
if you are moving your first steps into iNMR, the visual guides are a great starting point
Accurate Phase and Baseline Corrections
things to remember when correcting the phase:
- a difficult problem in 2 variables can always be transformed into two simple problems in 1 variable each
- don't look at the peak, look at the two segments of baseline surrounding it
- when the phase is correct, the two segments are symmetrical
- when the phase is not correct, the two segments are anti-symmetrical
Here we show a general method for correcting both phase and baseline of a 1D spectrum, based on the semi-automatic routines of iNMR. We assume that you are using the program for the first time. You can download this sample spectrum, unpack it by double clicking and follow our step-by-step instructions. You will discover that manual corrections are just as easy to perform as automatic corrections, but give you more accurate results.
Launch iNMR. When you are asked to select a file, choose any file within the downloaded folder. When you see the FID, click on the “gears” icon. The FT and automatic phase correction will be applied.
We want to clearly observe the phase and baseline anomalies of our spectrum. All the routines for automatic phase correction generally seem fantastic only because spectra are miniaturized. With iNMR it is possible to see many more details, defects included. Press the plus key on the keyboard several times in order to scale up the spectrum and thus see the baseline clearly. For example, on an iMac with a 20” monitor and this particular spectrum, it would be necessary to press the plus key 9 times:
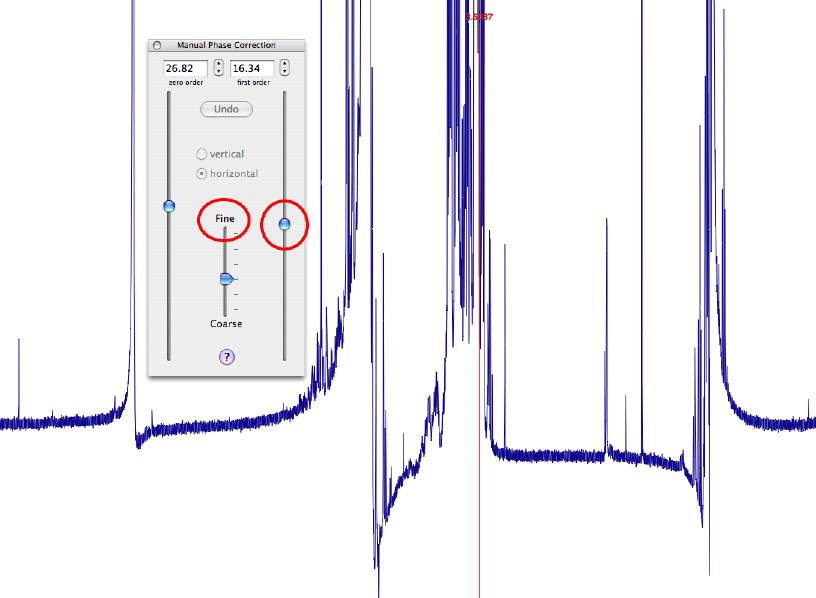
On a standard scale of reproduction, this would appear to be a good enough phase correction. However, only the multiplet which falls between 3 and 4 ppm is really in phase. Move the mouse near it. While pressing the Cmd key, click at the frequency 3.5 ppm. This will cause a vertical red mark to appear. This represents a request (to the phase correction module) to preserve the phase of the signal at this frequency. On your palette click on the icon like the one shown here on the right, which will open the manual phase correction panel.
Ideally you should never touch the left-hand side slider. Move the right slider until the peak at 7.13 ppm is in phase. The numerical values at the top of the manual phase correction panel will now read 11.20 and 41.44. Now move the red mark from its original position (where it was created) to the singlet at 7.13 ppm. We are going to keep the phase of this singlet stable while correcting the rest of the spectrum. This “stabilization” convention only applies to the right slider. This is why we recommend not touching the left slider. Move the middle slider to the upper “Fine” position: this makes interactive adjustment of the phase easier.
We now need to make the tails of the signal at 1 ppm symmetric and also to flatten the baseline. Look at the latter:
The segments of baseline at the two ends of the spectrum do not line up, but run parallel to one another. This is a typical sign of the phase being incorrect. It would be preferable to have the two ends converge or have one continuous line even if it is not perfectly flat. Move the right slider again until the number at the top-right (“first order”) reads 43.74. The spectrum should look better. Close the manual phase correction panel. To remove the red mark Cmd-click on it - the same operation that created it will delete it.
While manual phase correction is generally more accurate and gives better results than the automatic method, with baseline correction the situation is reversed. Click on the red icon, like the one shown here on the left. A sheet dialog will appear under the window title and a red line will appear over the baseline: it is the automatic correction proposed by iNMR. We are going to choose a more traditional polynomial correction. It is a less efficient approximation but has two operative advantages: it can be easily removed (with the command “Process/Clear Correction”) and it allows for further phase correction, should you need it. Select the option “Fit with a Polynomial” and apply a correction of the 7th degree as shown here below:
The red line will change every time you choose a different combination of parameters. Normally the fit improves gradually to a maximum and then worsens. When fitting with a polynomial, the best result is often given by a high degree. Press “OK” to subtract the red line from the spectrum.
You may also need to correct the ppm scale. If you already know the exact frequency of a peak, for example the reference TMS peak, right-click on it and choose “Reference Scale”. A sheet dialog will appear. Enter the known frequency of that peak. You may have noticed that all the dialogs contain an help button. Clicking on that button will open the corresponding page of the manual, which contains more in-depth information than is possible in this introductory tutorial.
In conclusion, we have shown that iNMR can correct both the phase and the baseline with great accuracy. Even an absolute beginner should aim for perfection, combining the manual methods with the automatic methods and paying attention to a few crucial details.