|
|
|
|
|
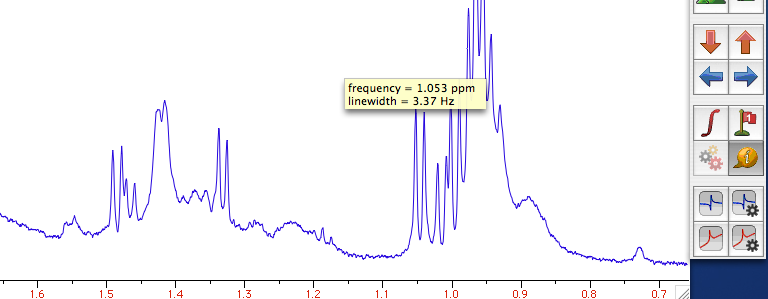
The interpolator tool: if you hover over a peak with this tool, the frequency of the maximum will be displayed. If you click & drag, the same tool will calculate the difference between two peaks. If you first select a region, then pick the tool, iNMR will stamp the width of that region. |